Forage virtual experience

Tata Data Visualisation: Empowering Business with Effective Insights
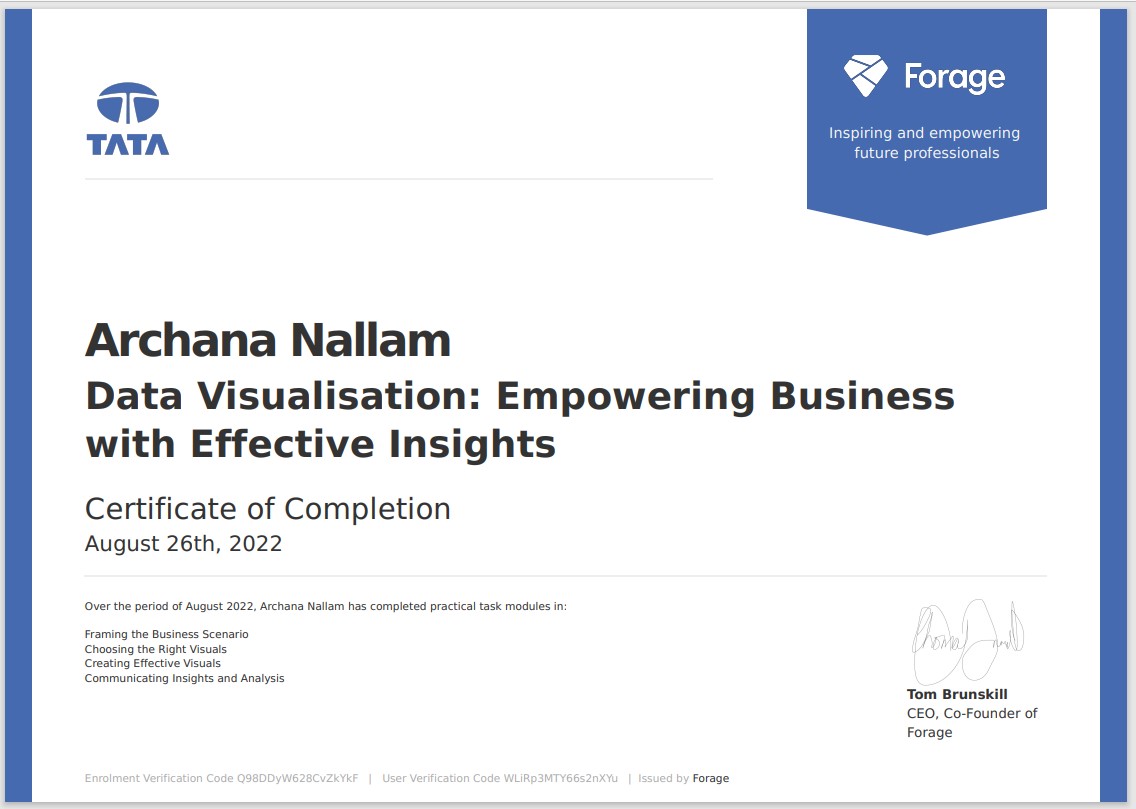
This helped me experience the different phases of data analysis and I performed the following tasks as part of this project:
      * Framing the questions for the business scenario, which is the first thing to be done to perform any data
         analysis
      * Selecting the best visuals which could answer the above questions in a simple but efficient way to the
         management
      * Performing data cleaning
      * Creating all the visuals using either Tableau or Power BI. I chose Microsoft Power BI for this
      * Finally, creating a presentation to communicate the results of my analysis to the business users
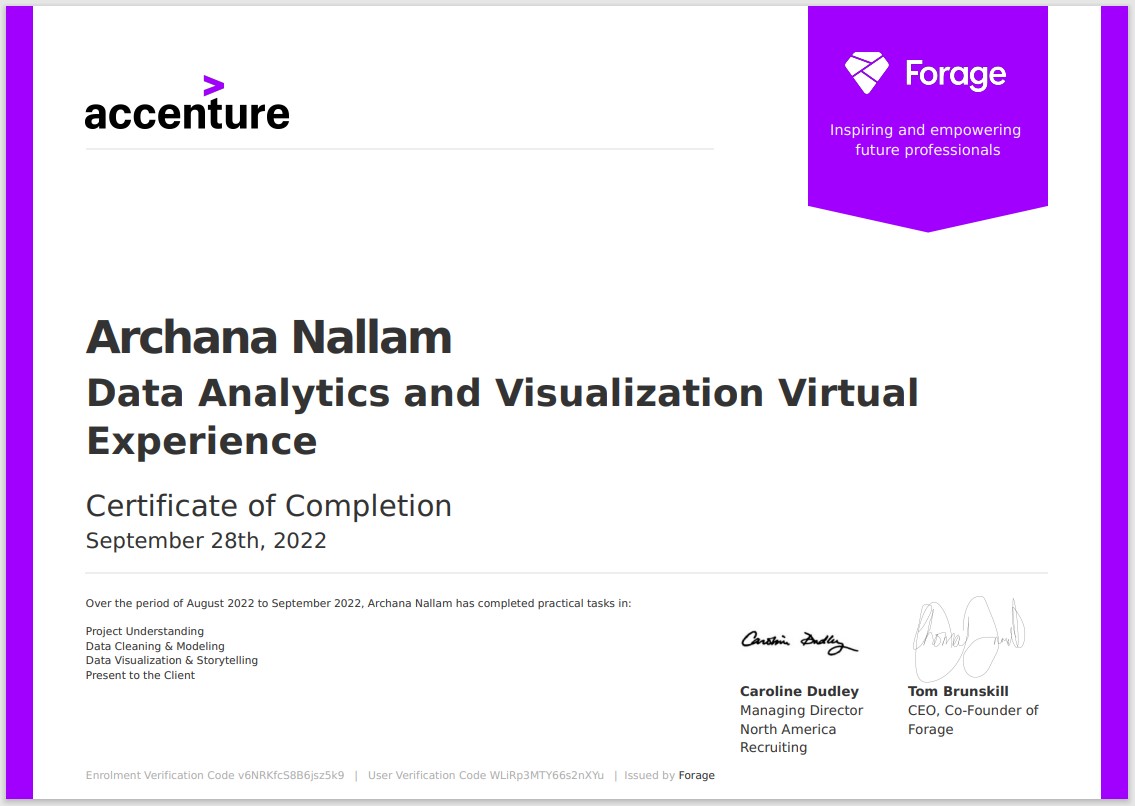
Accenture North America Data Analytics and Visualization

During this experience, I have learnt how to:
      * Understand the business of the client and the main objective of the project
      * Understand the roles and responsibilities of all the internal stakeholders
      * Extract the data and understand the relationship among all the source tables
      * Perform data cleaning and process the data to arrive at a consolidated dataset which will be relevant for the analysis.
         This was done using table merge options in Power Query
      * Create visualizations using Power BI to provide insights on the subject of interest for the client
      * Prepare a presentation to share the insights with the business users